
You can get year over year calculations in Tableau quite easily with the quick table calculations. This method begins to fall short however as it limits the visualization options and often results in using more table calculations to “hide” unwanted months/years, etc.
Enter one of the things I am MOST excited about with Tableau Prep! Simple ways to structure your data for more advanced and appealing year over year visuals in Tableau. This post discusses a BASIC approach to structuring your data for easy year over year analysis and can serve as a starting point for things like YTD, MOM, and the more advanced requirements.
The .tfl file can be found here, and the dashboard created off of it can be found here.
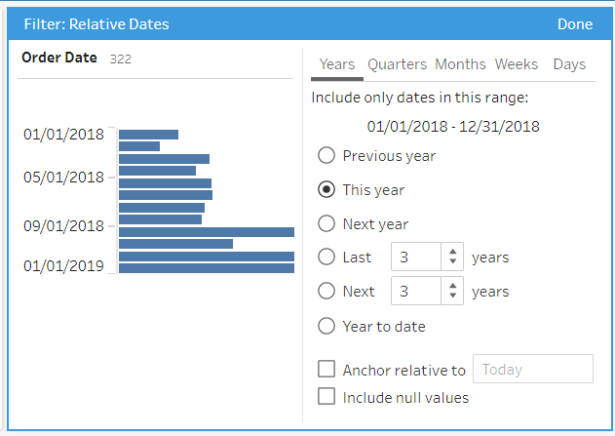
First, we will create a split for this year by leveraging the “Relative Date Filter”:
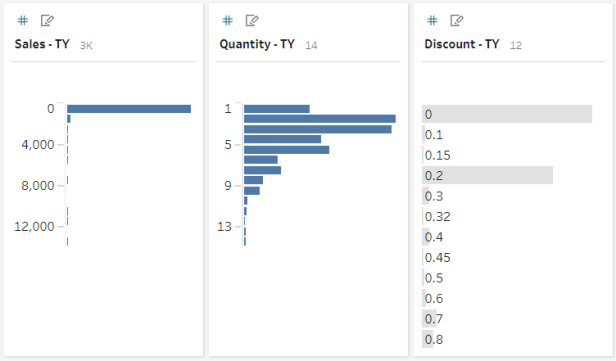
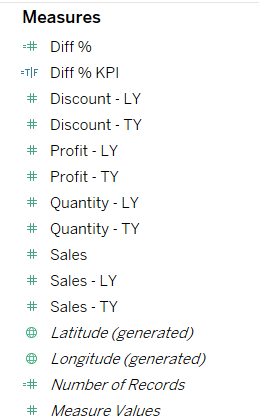
We will then want to change the names (and/or make copies if we want – so you can still see the overall numbers) of the measures so that they don’t line up when we union last year:
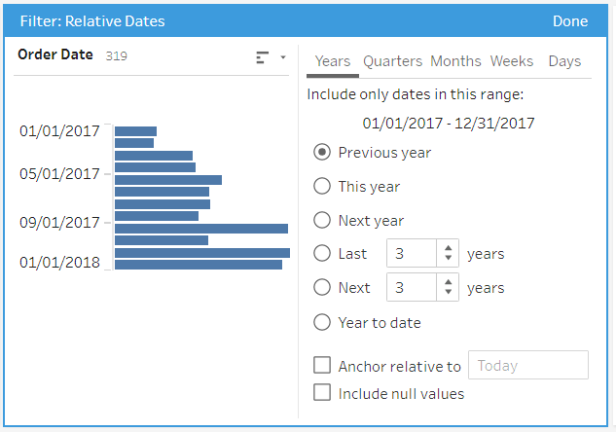
Next, we’ll add a branch and repeat the process for last year:
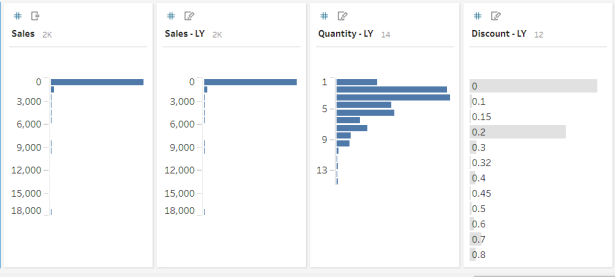
By renaming the columns, we will create measures unique to the dates they correspond to. By leaving a column “Sales” in both partitions, we are able to get a total across the whole time spectrum (instead of needing to say Sales TY + Sales LY = Total Sales).
Now we can union the two parts back together:
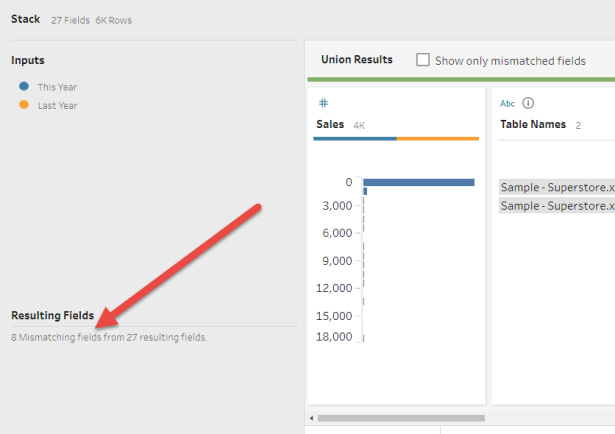
You will notice the mismatching fields – we want this! By setting it up this way, we can easily compare the metrics in different ways in Tableau desktop:
This is just a very basic example that I hope will get the juices flowing for what is possible with Prep!
