Viz in tooltip is one of the most exciting desktop features released in a while. It allows a creator to incorporate so much more information into a single mark and is an interaction method that can feel even more natural than clicking.
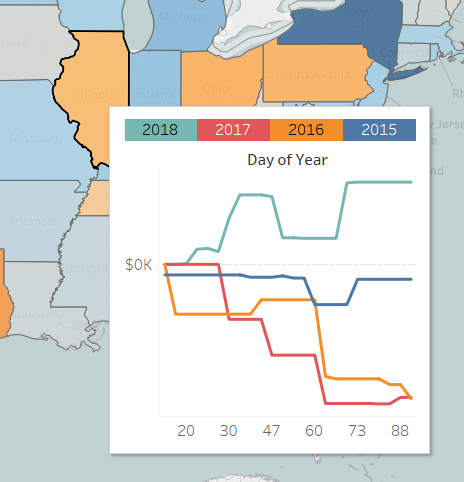
One little pain point I noticed with them, however, was the lack of a legend in the viz I exposed in the tooltip. This made it a bit confusing, especially when leveraging a tooltip for something like a year over year comparison – knowing which line is which year is pretty crucial!
Here’s a quick way to leverage another sheet to serve as your color legend (workbook here).
Make a new sheet with your placeholder axis of choice (I always just use MIN(Number of Records) and place your desired legend dimension on Color and Text:
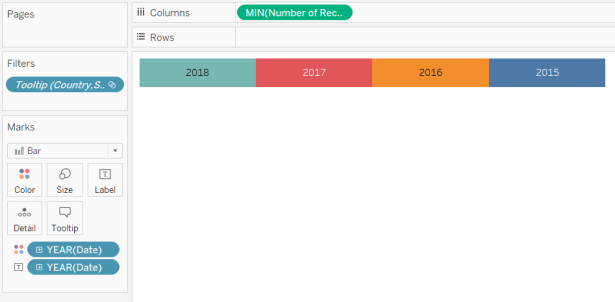
Next, fix the axis and hide the header. Make sure that your sheet is set to “Entire View” instead of “Standard”.
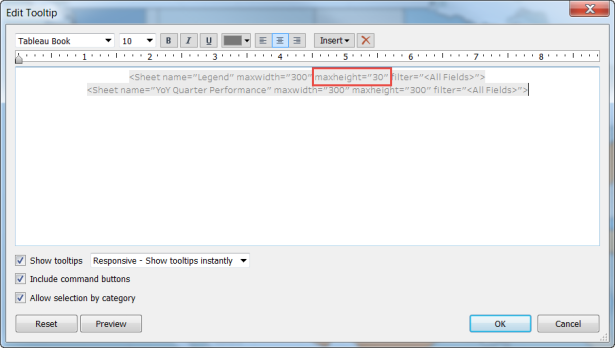
Once you have that sheet, you can simply add it above your other viz in tooltip and set the height to a smaller value that helps give it the feel of a legend (make sure you use the same widths, too, so it is centered):
And that’s all it takes! Tooltip on.